RSI = 100 - ( 100/1+ rs )
Where rs = average of X day's up closes / average of X day's down closes.
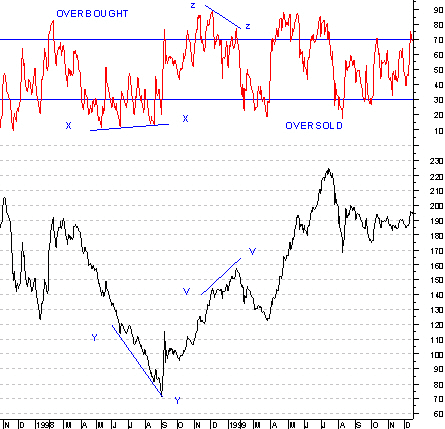
The maximum and minimum levels that the RSI indicator can theoretically go to are 100 and 0. Usually if the RSI is above 70, it is overbought and if it is below 30, it is oversold. These are useful for short-term traders.
An important use of RSI is when there is a divergence between the company's price or a market index and its RSI. A "bullish divergence" signals a short-term bottom while a 'bearish divergence" signals a short-term peak.