|
Principle No 3:
Is Using Beta The Real Risk ?
Different types of investors view investment risks differently. An ordinary investor might perceive risks as the probability of losses beyond a certain range (ie. 10-20%) while others, especially those who subscribe to the modern portfolio theory or have been taught modern finance theory, would view beta as the appropriate measure of risk. Beta is the volatility of a stock's price against the general market. However, as a value investor, we strongly advocate that an investor should instead be concerned with the risks that are associated with the company and its underlying business. The emphasis on beta as a measurement of risks, even though they are being taught in universities and popular professional finance courses, does not make investment sense and can be disastrous. Here are a few reasons supporting our point of view.
First, the beta of a stock is derived purely from the historical movement or variability of the share price of a counter against the general market, commonly a benchmark index like the KLSE Composite Index. Even if one accepts the concept of volatility as the relevant measure of risk, there is also the problem of what benchmark to use. The backward-looking bias of beta would also raise concerns on its ability to represent future performance and hence, the perceived risk characteristics of the stock. Secondly, a beta is not a constant figure but one that changes continuously based on the next available data, making it unstable. Thirdly and more importantly, beta does not reflect the risks associated with a company's financial conditions, its management quality and the long-term economics of the business.
We do not need to remind our subscribers that all the PN4 companies recently featured in i Capital were undone by a combination of poor management, deteriorating economics of the business, and the company's weak balance sheet. A beta merely describes a feature of a stock, in particular its price movement but not the risks associated with investing in a company or business. In gauging his or her investment risks, one then has to pay attention to the variables that are grouped under [1] management quality, [2] long-term economics of the business and [3] financial strength. Management quality can be measured by financial indicators like return on equity and return on capital employed. Understanding the economics of a business is more complex and has to be seen from many aspects : regulation, the structure of an industry, sustainable earning power and margin, free cash flow, technological changes and consumer tastes are just some of the aspects that needs to be well understood. Financial strength relates to a company's balance sheet and the cash flow aspects of the business. Understanding the long-term economics would greatly help in evaluating a company's financial strength.
With the help of rigorous financial statement analysis and extensive reading, an investor would be able to assess a company's management quality and financial strength and the business' long-term economics. With these, an investor would be able to identify the early warning signs before they develop into the financial catastrophes that were experienced by all the PN4 companies featured. Only by knowing and understanding a company's management quality, the business underlying economics and a company's financial strength, can an investor truly gauge the risks involved. Hence, it would be more worthwhile for investors to invest their time and effort in knowing the company's underlying business, its strengths and weaknesses (to be elaborated in a later issue) rather than to focus on its share price movements. Such efforts would ultimately yield a decent return and avoid such debilitating losses experienced by shareholders of the PN4 companies. By aiming at beta as a measurement of risks instead of a company's fundamentals, an investor becomes blinded.
Principle No 4 :
Does It Pay To Be A Lemming ?
There is a Made-in-Malaysia myth that the Main Board counters are more liquid and less risky than the Second Board counters. This myth has been around since the Second Board was started, no thanks to the popularity of market timing, the influence of large institutional funds and well-intentioned but naïve regulators. These days, almost all institutional funds would demand adequate liquidity as a pre-requisite for investing in stocks and as a result, most 2nd Board counters, no matter how attractive they are, are shunned. This is due to the reasoning that they need adequate liquidity to buy - the so-called institutions, either local or foreign, are always in a hurry to buy. This behavior can be explained by their lemming-like thinking and market timing investing style. These so-called institutions also need sufficient liquidity to sell - in the event of a dramatic turnaround in fortunes or a crisis happening. Another misconception is that the 2nd Board counters are inherently more risky due to their lack of liquidity and lower market capitalisation.
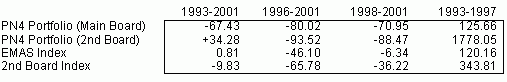
Table 1 : Cumulative Returns
Are 2nd Board counters more risky ? Should investors opt for Main Board counters instead ? i Capital has in the past written on this topic extensively but for the purpose of this article, it is using the PN4 portfolio to further reaffirm what it has advised. The evidence on these points is conflicting - please refer to table 1.
First, based on the results of the EMAS and 2nd Board indices during 1993-2001, 1996-2001 and 1998-2001 periods shown in table 6, one can conclude that the EMAS index performed relatively better than the 2nd Board index, indicating a safer bet for investors. But the returns made during the 1993-1997 period showed that the 2nd Board, based on either the Second Board index or the PN4 Second Board portfolio, has substantially outperformed the Main Board index or the PN4 Main Board portfolio, although this was wiped out in the ensuing bear markets. What these results show is that the Second Board is more volatile. If risk is defined as volatility, then, the Second Board is more "risky". As we explain above, risk does not equal volatility. For a value investor, who is conservative by nature, volatility is welcomed. In addition, if we were to compare based on the PN4 portfolio, the PN4 companies from the 2nd Board incurred lower losses than its counterparts from the Main Board. Some may argue that this is an exception rather than the norm. Take a look at table 2 then. Barring Jutajaya and Long Huat, the other 2nd Board counters fared better, in terms of lower losses or gains, than their more esteemed Main Board counterparts.
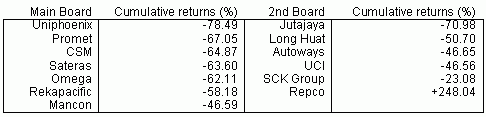
Table 2 : Performance of individual stocks for 1993-2001
Well then, what could we make out of this ? We believe it is fair to say that while the above results may not prove that 2nd Board counters are more attractive, it does disprove the notion that these counters are more risky than their big brothers on the Main Board. It is our view that each individual stock, its management, financial strength and its underlying business should be assessed on its own merits. It should not be stereotyped into certain categories, based on their market capitalization or liquidity or board. To conclude that one is more risky or more attractive than another, based purely on such general characteristics, would be very misleading and unproductive for investors. An alert subscriber may notice that the performance of Repco distorted the above results and thus, should be excluded. In reality, there are always outliers or the exceptions. The trick really is not to exclude them but to be able to spot these exceptions early on.
Principle No 5 :
Does Dollar-cost Averaging Work?
These days, mutual funds or unit trust companies sell the advantages of dollar-cost averaging principle to the investing public. Some investors had even used this strategy and apply it to their investments in the post-1997 bearish phase, in the hope of minimizing their losses or exiting with a profit. Does dollar-cost averaging work?
Dollar-cost averaging is basically a disciplined, regular investment technique, which involves a fixed sum of money being invested in a portfolio, fund or individual stock over a period of time. It works based on the concept that that same amount of money, from regular inputs, would be able to purchase less shares when the share price is high and more shares when it is low. Thus, the systematic accumulation of shares would average down the average cost of an investment. On paper, dollar cost averaging sounds sensible but .........
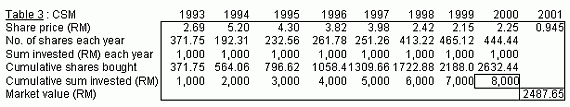
Table 3 : CSM
As presented in table 3 above, had an investor blindly followed this principle and invested a fixed yearly sum of RM1,000 in either CSM or Sateras, he would have realized huge investment losses by 15 Feb 2001. For a total investment of RM8,000 spread over 8 years, the CSM investor would be left with only about RM2,487 or a massive loss of almost 69%.
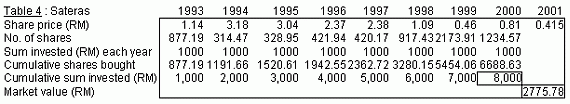
Table 4 : Sateras
The Sateras investor - table 4 - would not fare any better, as he would be staring at a loss of more than 65%. The 8 years are fairly representative of all types of market conditions - it captured the 1993 bull, the 1995-96 2nd board rally, the 1997-98 plunge and the sharp 1999 rally. Table 5 shows that a dollar-cost averaging method does not work for a Second Board counter also.
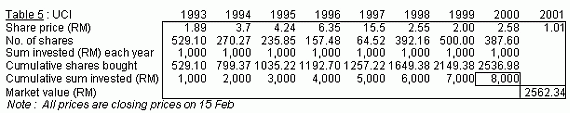
Table 5 : UCI
The examples serve to remind subscribers that the almost foolproof, commonly encouraged, passive method of investing has its fair share of risks and one should be aware of it before applying it in one's investing strategy. Should one throw away the dollar cost averaging method then ? This method is indeed useful when it is based on prudent and careful stock selection. Picking the right stock is the most important factor. Once the right stock is selected, then, the dollar cost averaging method can do wonders. Why ? When the right stock is selected and the investor buys more of the stock as and when the share price drops, the investor is actually engaging in value investing.
Previously, we have explained the myth of diversification, whether market-timing works, what risk really is, whether the Second Board should be avoided and the supposed efficacy of dollar-cost averaging, another popular myth. The main theme that runs through this analysis is a very simple fact about investing. It is so basic, so simple and yet totally ignored and overlooked by investors, analysts, fund managers, policymakers and regulators. Stock selection is of paramount importance in investing. Once you do not overpay for the right stock, it is very hard to lose. This concludes our investing lessons and this exclusive conclusion series will continue with lessons for managing businesses.
|